Building a Simple Energy Display with esphome
Anatoly Mironov
Sometimes a small display is more useful than another smartphone app.
Why I built it
I have been experimenting with Home Assistant in our home for a while. It started with monitoring temperature and humidity, but gradually expanded to electricity prices, power consumption, heating, and even reading our water meter.
Home Assistant is great for collecting and visualizing all this information. I can open its dashboard and see almost everything I need.
But there is one problem: I have to open the dashboard.
I wanted something simpler. A small display that would show the most important information at a glance, without reaching for a phone or opening an application.
I also wanted the information to be understandable to the rest of the family.
That became a small weekend electronics project.
The hardware
I already had most of the components:
- Raspberry Pi Pico W — a small microcontroller with built-in Wi-Fi.
- SparkFun SerLCD 20×4 — a character LCD with four rows and 20 characters per row, connected over I²C.
- A few jumper wires.
- A USB power supply.
The Pico W is a good fit for this kind of project. It is inexpensive, uses little power, and can communicate with Home Assistant over Wi-Fi.
The LCD is deliberately simple. It is not a touchscreen, it has no graphical interface, and it does not need one. Its job is to show a handful of numbers.
Connecting the display
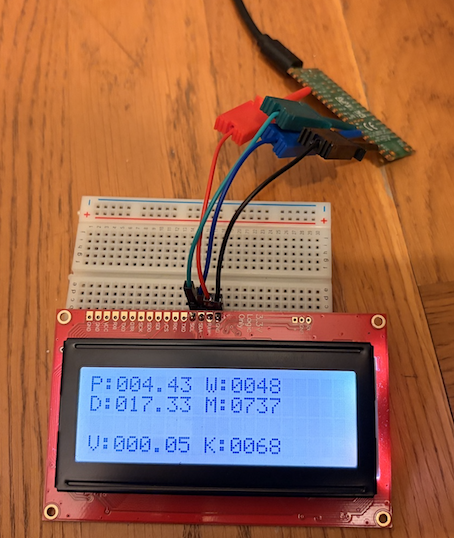
The SerLCD communicates using I²C, so only four connections are needed:
| Pico W | SerLCD |
|---|---|
| GPIO20 | SDA |
| GPIO21 | SCL |
| 3V3 | VCC |
| GND | GND |
In my configuration, the I²C address is 0x72, with the bus running at 100 kHz.
The wiring is straightforward, although I intend to make the connections more permanent once I decide how to mount the display.
ESPHome instead of writing firmware from scratch
I could have programmed the Pico W directly using C++ or MicroPython. Instead, I chose ESPHome.
ESPHome allows me to describe the device using YAML and integrate it with Home Assistant without writing the networking and authentication code myself.
It handles Wi-Fi, the encrypted Home Assistant API connection, and over-the-air firmware updates.
One complication was that my Home Assistant installation runs on a Raspberry Pi 3. Running the ESPHome build environment there was not particularly practical, so I moved ESPHome Device Builder to my Mac.
The firmware can still be uploaded to the Pico W over Wi-Fi.
What the display shows
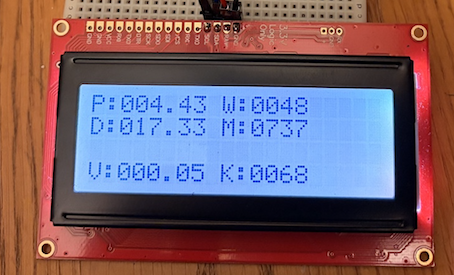
The display has six values, organized into three groups.
P:002.45 W:0518
D:049.58 M:0730

V:012.50 K:0044
The letters are short labels:
| Label | Meaning |
|---|---|
| P | Current full electricity price, SEK/kWh |
| W | Current electrical power, watts |
| D | Today’s variable electricity cost, SEK |
| M | This month’s variable electricity cost, SEK |
| V | Today’s variable water cost, SEK |
| K | This month’s variable water cost, SEK |
The P value includes both the electricity supplier’s price and the additional grid-related costs that I calculate in Home Assistant.
For water, I use data collected from our Kamstrup water meter. That is also why I chose K as the label for the monthly water cost.
The monthly costs are rounded to whole Swedish kronor. For daily costs, I keep two decimal places.
The third row is currently empty. I might use it later to show when electricity is cheapest or most expensive during the day.
Let Home Assistant do the calculations
An important design decision was to keep the Pico W as simple as possible.
It does not calculate electricity prices, grid charges, or water costs. Home Assistant already does that.
The Pico W simply subscribes to six Home Assistant sensors and displays their values.
For example, the full electricity price comes from:
- platform: homeassistant
  id: full_price
  entity_id: sensor.electricity_full_price
The monthly electricity cost is retrieved in the same way:
- platform: homeassistant
  id: electricity_month
  entity_id: sensor.electricity_variable_cost_this_month
This separation is convenient. If I change how a cost is calculated, I only need to update Home Assistant. The display firmware can remain unchanged.
The surprisingly difficult part: updating an LCD
I initially expected the display itself to be the easiest part of the project.
It wasn’t.
Writing text to the SerLCD over I²C worked fairly quickly. But displaying several changing values at fixed positions turned out to be more challenging.
I encountered a few interesting problems:
Missing labels after reboot. The Pico W would start and display sensor values, but the labels were missing. Moving display initialization to a later point in the startup sequence helped.
Flickering. My first working solution cleared and redrew the entire screen every 30 seconds. It worked, but the blinking was distracting.
Text appearing in unexpected positions. Some values would disappear, or characters would overwrite labels. I experimented with cursor positions, field widths, and short delays between I²C commands.
The final approach initializes the display once and remembers the last text written to each field.
Before updating a value, it checks whether the formatted text has changed:
if (id(previous_values)[index] == text) return;If the value is unchanged, nothing is written to the LCD.
If it has changed, ESPHome moves the cursor to the correct position and writes only that field.
I also added short delays between cursor commands and text writes. This helped make the display behave more reliably.
Another practical improvement was shortening the monthly cost fields. Showing 0730 instead of 0730.28 is perfectly adequate for my purposes and uses fewer characters.
It was a useful reminder that even a simple character LCD can have its quirks.
Source code
The complete ESPHome configuration is available in my public GitHub repository:
Raspberry Pi Pico W energy display — 038_esphome.yaml
The configuration includes the Home Assistant sensor definitions, I²C setup, LCD initialization, value formatting, and selective updates.
Wi-Fi credentials and API encryption keys are kept separately in secrets.yaml, rather than being stored in the public repository.
What comes next?
For now, the display does exactly what I wanted: it makes electricity and water costs visible without requiring anyone to open an app.
There are still some improvements I might make.
The electronics need a proper enclosure, and I would like to mount the display somewhere convenient. I also have an RGB LED ring that could potentially indicate when electricity is particularly expensive.
Another idea is to use the currently empty third row for information about the cheapest electricity hours.
But I don’t want to overcomplicate it. Part of the appeal is that it does very little, and does it continuously.
The most satisfying part of the project is that several things I have built separately — Home Assistant sensors, electricity price calculations, and the wireless Kamstrup water meter reader — now come together in one small physical device.
And unlike a dashboard on a computer or phone, this one is always there.
Source code: GitHub — tolle-rasp/pico/038_esphome.yaml